Блиц – это проверка усвоенного материала учеником.
В течение 1 часа (60 минут) преподаватель задаёт вопросы по пройденным темам, и ученик пишет код, одновременно комментируя и отвечая на вопросы преподавателя.
Мы уверены в эффективности данного подхода, он позволит нам понять, уровень усвоенного материала, а так же выявить темы, которые были не до конца усвоены и требуют дополнительного домашнего задания.
Тем самым сможем анализировать ответы, улучшая программы курсов и обучающий процесс.
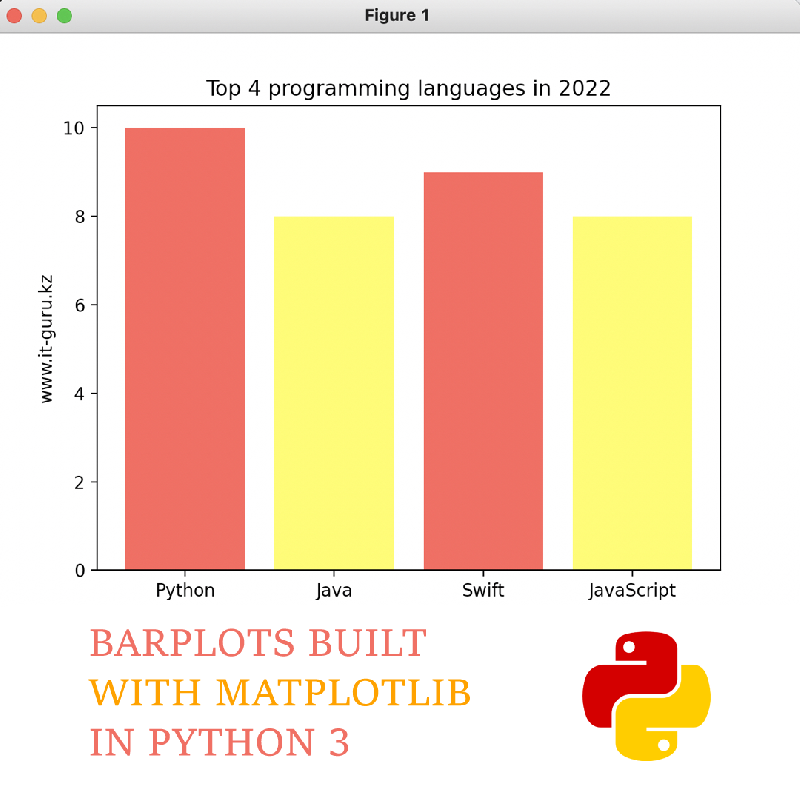


performance = [10, 8, 9, 8]
y_pos = np.arange(len(objects))
Create bars with different colors
plt.bar(y_pos, performance, align='center', alpha=0.7, color=['red', 'yellow', 'red', 'yellow'])
Create names on the x-axis
plt.xticks(y_pos, objects)
Read more graph
Youtube channel
GURU IS YOUR BEST SOLUTION!
&image=/upload/iblock/10c/qprd6cnmq8qdeuew9405mbmol1da7tbt/Barplots%20built%20with%20matplotlib%20in%20Python%203%20chart.png&noparse=true)